CPET 581 Smart Grid & Energy Management
2013/9/5
Lecture
4
Topics
of Discussion
Discussion of "Electric Power Cost Reduction & Management through Computer-based Predictive Control," Chri Hayes, Advisor Paul Lin.
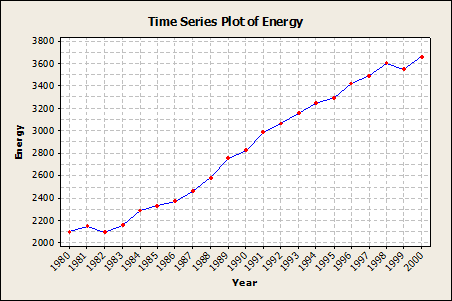
Question 6-81. The total net electricity consumption of the U.S. by year from 1980-2002 (in billion kilowatt hours) follows. Net consumption excludes the energy consumed by the generating units. Read left to right.
2094.45, 2147.10, 2086.44, 2150.96, 2150.96, 2285.80, 2323.97, 2368.75, 2457.27, 2578.06, 2754.95, 2826.59, 2988.97, 3068.67, 3157.35, 3246.98, 3294.04, 3425.13, 3425.13, 3494.60, 3604.68, 3553.79, 3659.99
(Source: U.S. Department of Energy Web site http://www.eia.doe.gov/emeu/international/electric.html#Consumption Total)
(Source: Text Book of IT 507 and TECH 646: Applied Statistics and
Probability for Engineers, 4th edition, by Douglas C.
Montgomery and George C. Runger, Published by John
Wiley & Sons, Inc)
Question:
· A) Construct a time series plot of these data.
· B) Construct and interpret a stem-and-leaf display of these data.
Solution (A)
1) Enter years in the first column
2) Enter Energy consumption in the 2nd column
3) Graph => Time Series Plot
4) Chose “Simple Plot”
5) Click “Energy” in the left side window, then click “select” to move it into “Series” window on the right.
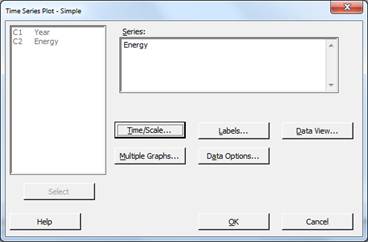
6) Select “Calendar” radio button, drop down box to select “Year”; put starting year “1980” as shown.
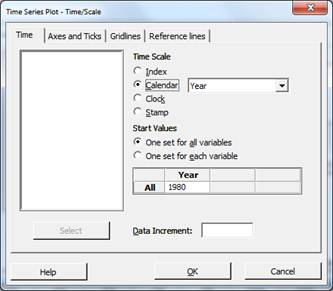
7) Click OK to see the Time Series Plot of Energy.
8) Edit => Copy Graph to make a copy of the graph and the paste it on to the MW Word document below.
Solution (B): Stem-and-Leaf of
Energy Display – used to examine the shape and spread of sample data.
21 Observations
· Divide each number xi into two parts: a Stem, consisting of one or more of the leading digits, and a Leaf, consisting of the remaining digits
· List the Stem values in a vertical column
· Record the leaf for each observation besides its stem
· Write the units for stems and leaves on the display
The Stem-and-Leaf diagram below
looks like the uniform distribution. From the time series plot, there is an
increasing trend in energy consumption.
Stem-and-leaf of Energy N
= 21
Leaf Unit = 100
Count Stem Leaves
4 2 0011 (2000 2000 2100 2100)
7 2 233 (2200 2300 2300)
9 2 45 (2400 2500)
10 2 7 (2700)
(2) 2 89 (2800
2900)
9 3 01 (3000 3100)
7 3 22 (3200 3200)
5 3 445 (3400 3400 3500)
2 3 66 (3600 3600)
·
Energy Characteristics and Energy Consumed in
Large Hospital Buildings in the United States in 2007, Aug. 17, 2012, http://www.eia.gov/consumption/commercial/reports/2007/large-hospital.cfm
o
Table H1: Structural & Geographical
Information for Large Hospitals
o
Table H2: Fuels and End Uses in Large Hospitals
o
Table H3: End Use Equipment in Large Hospitals
o
Table H4: Lighting and Window Features in Large
Hospitals
o
Table H5: Major Fuels Usages for Large Hospitals
o
Table H6: Electricity Usage for Large Hospitals
o
Table H7: Natural Gas Usage for Large Hospitals
o
Table 8: Water Consumption Information for Large
Hospitals
18 Statistics on Hospital Energy Management, http://www.beckershospitalreview.com/strategic-planning/18-statistics-on-hospital-energy-consumption.html
Introduction to Energy Auditing & Energy Management, http://enersupply.euke.sk/wp-content/uploads/Introduction-to-EM-and-EA_P1_Fotini.pdf
· Bureau of Ocean Energy Management, http://www.boem.gov/Statistics-and-Facts/
o Video, Wind Energy Area (WEA), BOEM-Platts Energy Interview, http://www.boem.gov/BOEM-Newsroom/Video/BOEM-Platts-Energy-Interview.aspx
· New Energy for America, Bureau of Land Management, U.S. Dept of the Interior: , http://www.blm.gov/wo/st/en/prog/energy.html